A block model is easy to store and hard to inspect.
The data is a 3D grid of blocks, each carrying geological properties. In specialist desktop software, that makes sense. In a browser, a naive implementation turns into a wall of cubes and a dead frame rate. This project was a proof of concept for making that kind of model explorable from a web page.
The constraint
The hard part is not drawing cubes. It is drawing enough of them to be useful while keeping the model interactive.
A geological user needs to slice through the volume, change the property being colored, inspect patterns, and share a view. If the tool only shows the outside of the model, it hides the point. If it renders every block independently, it becomes too slow to use.
System shape
The viewer includes:
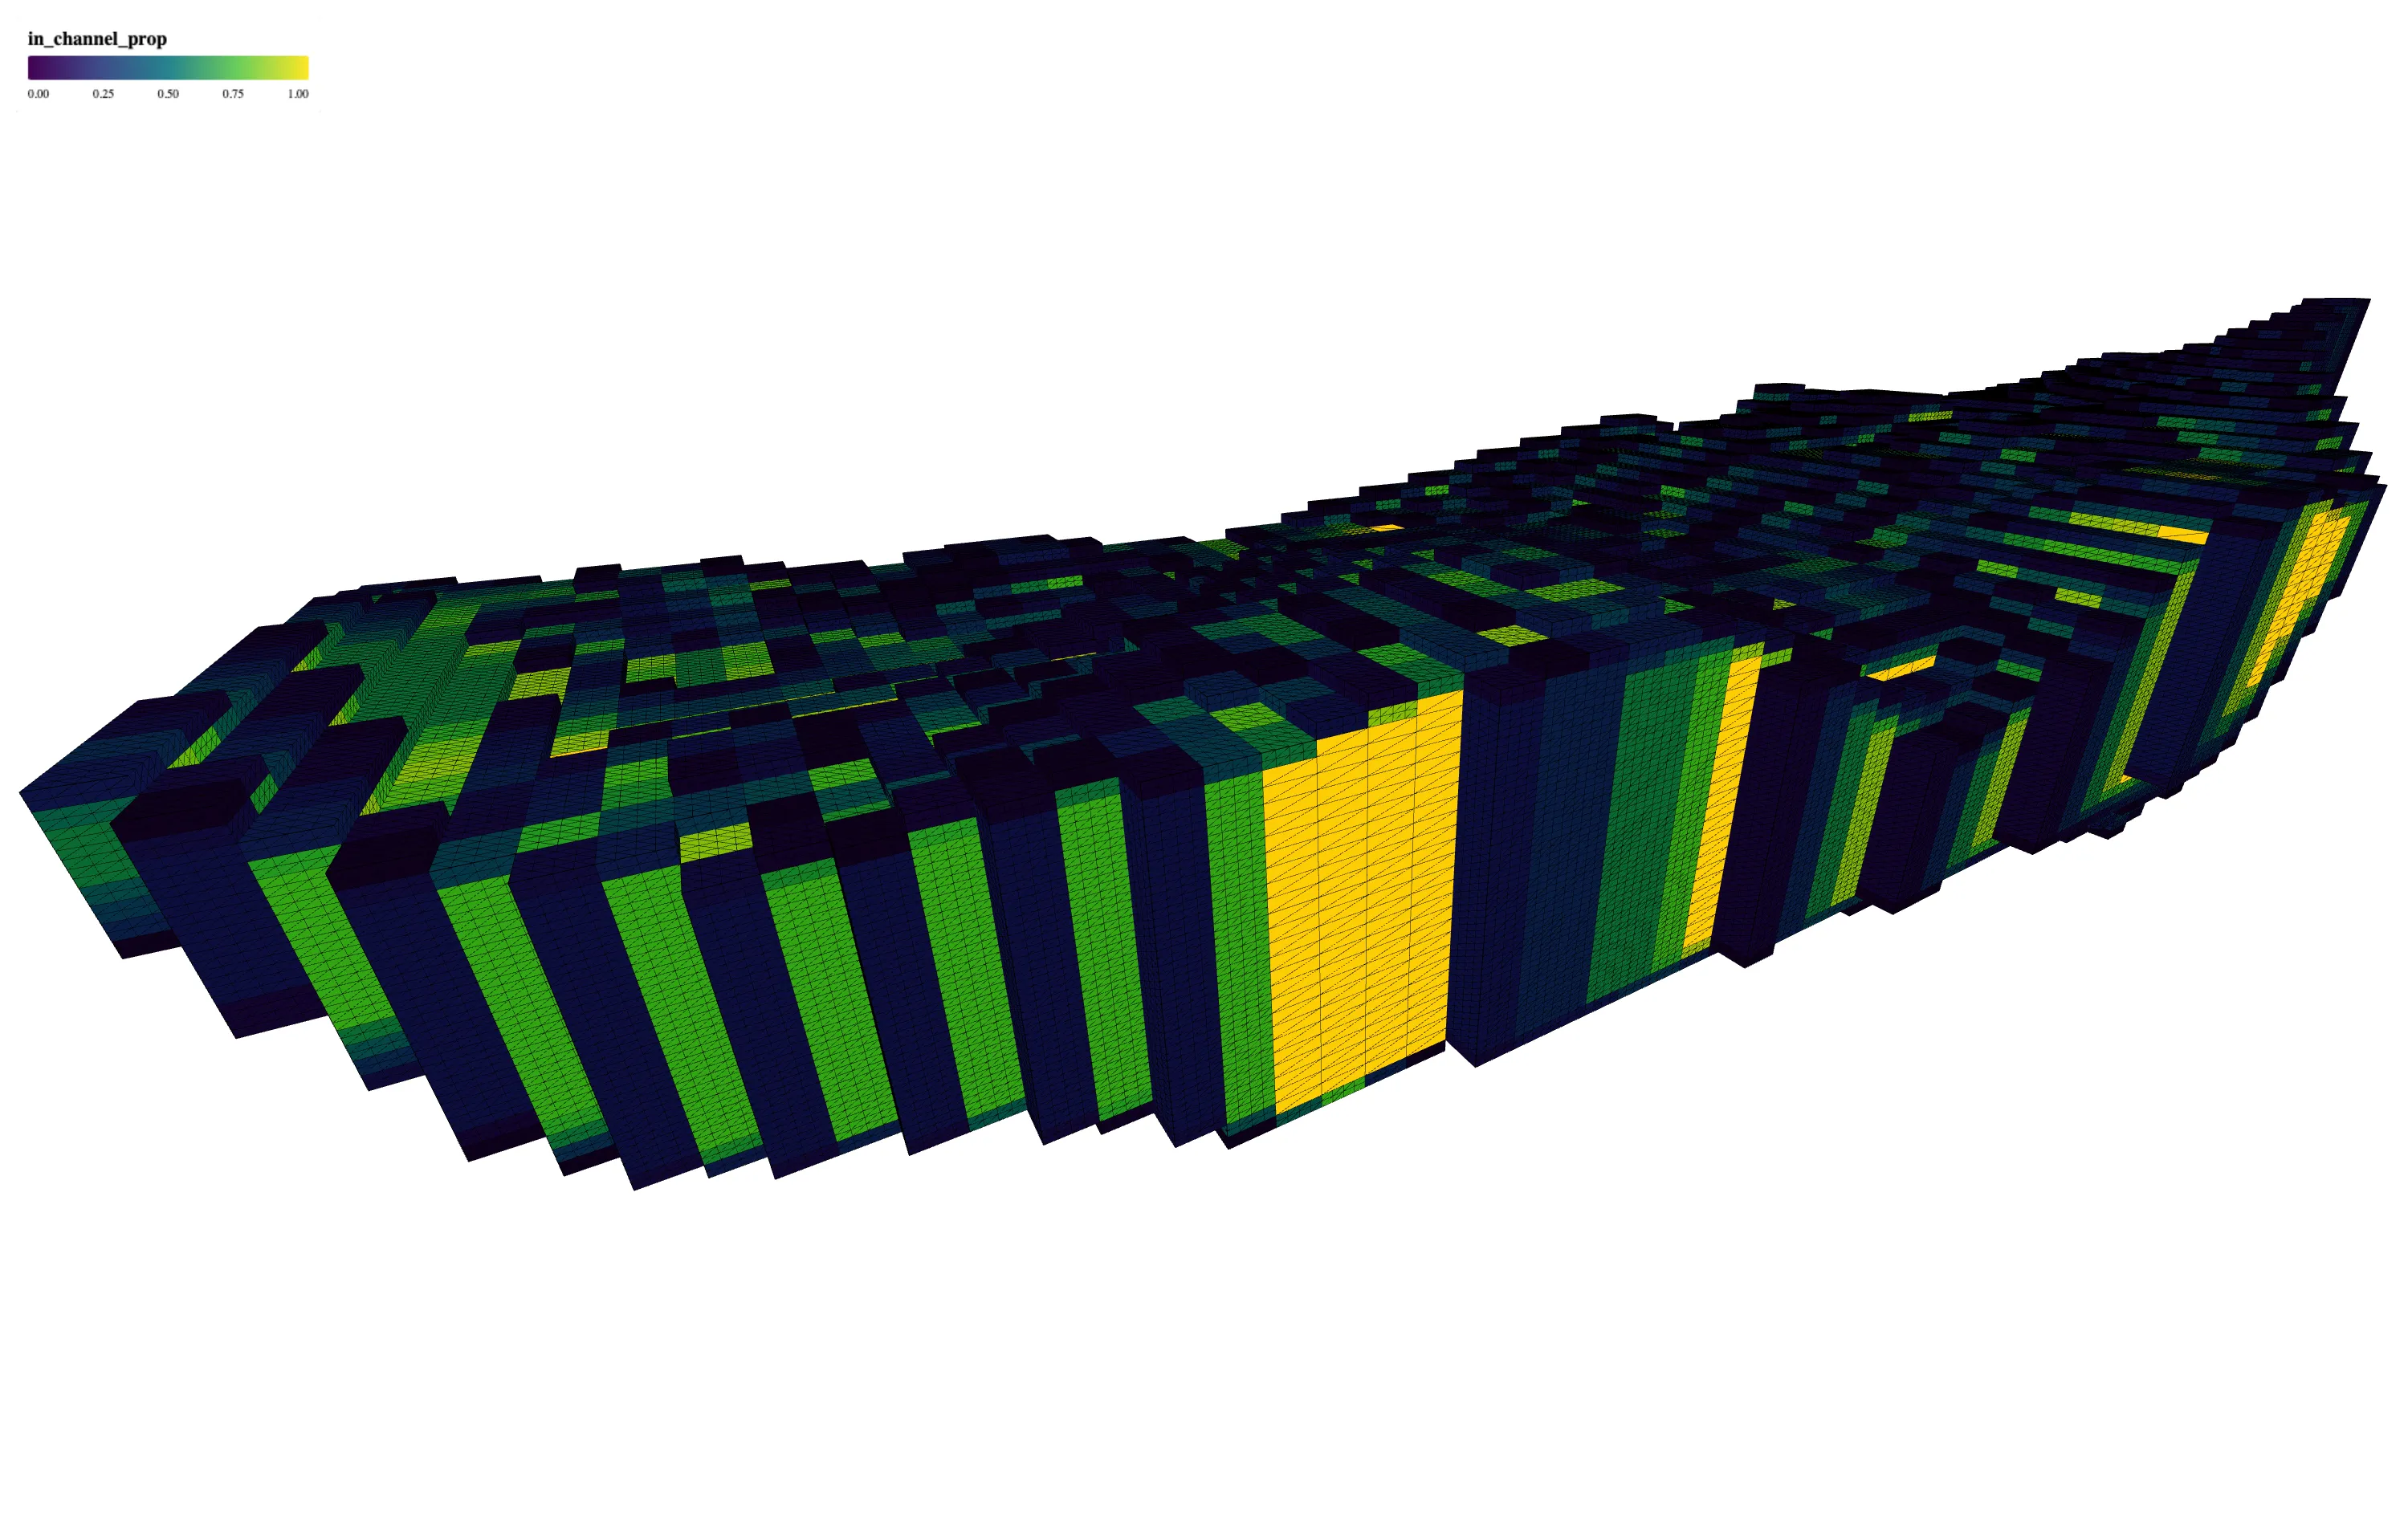
- 3D rendering for block model datasets
- instanced mesh rendering for large numbers of blocks
- property-based coloring for geological attributes
- cross-section controls across X, Y, and Z axes
- a screenshot workflow for sharing model views
The interface stays close to the domain task: choose a property, cut through the model, rotate the view, and capture the result.
The hard part
Instancing solved the first performance problem, but not the whole product problem.
The model still needed filtering, sensible defaults, and controls that did not require a tutorial. Geological users already understand the data. The interface should not make them learn a separate visualization vocabulary before they can inspect it.
That is the useful lesson from the POC: performance work and product simplification are the same problem when the dataset is this visual.
Stack
- React and TypeScript
- Three.js and React Three Fiber
- Vite
- Apache Arrow for efficient data handling