webgpuwebglshaderscss
Rendering experiments · Designer and developer · Live
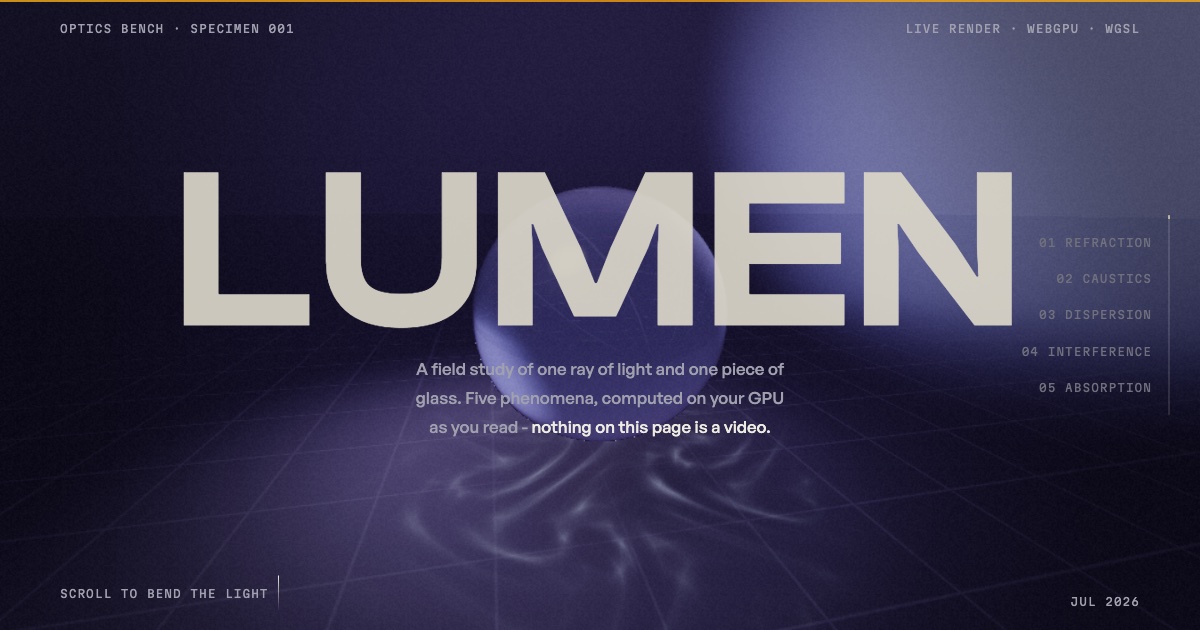
LUMEN & The Browser Is a Material
Two single-page rendering experiments testing how far the July 2026 web can go: WebGPU, WebGL 2, shaders, and the newest CSS. A raymarched optics bench, and a scroll essay drawn by the pipeline it describes.
Zero-dependency scroll essays that trade video for live, GPU-computed graphics: a WebGPU optics bench and a WebGL 2 tour of the browser's rendering pipeline.